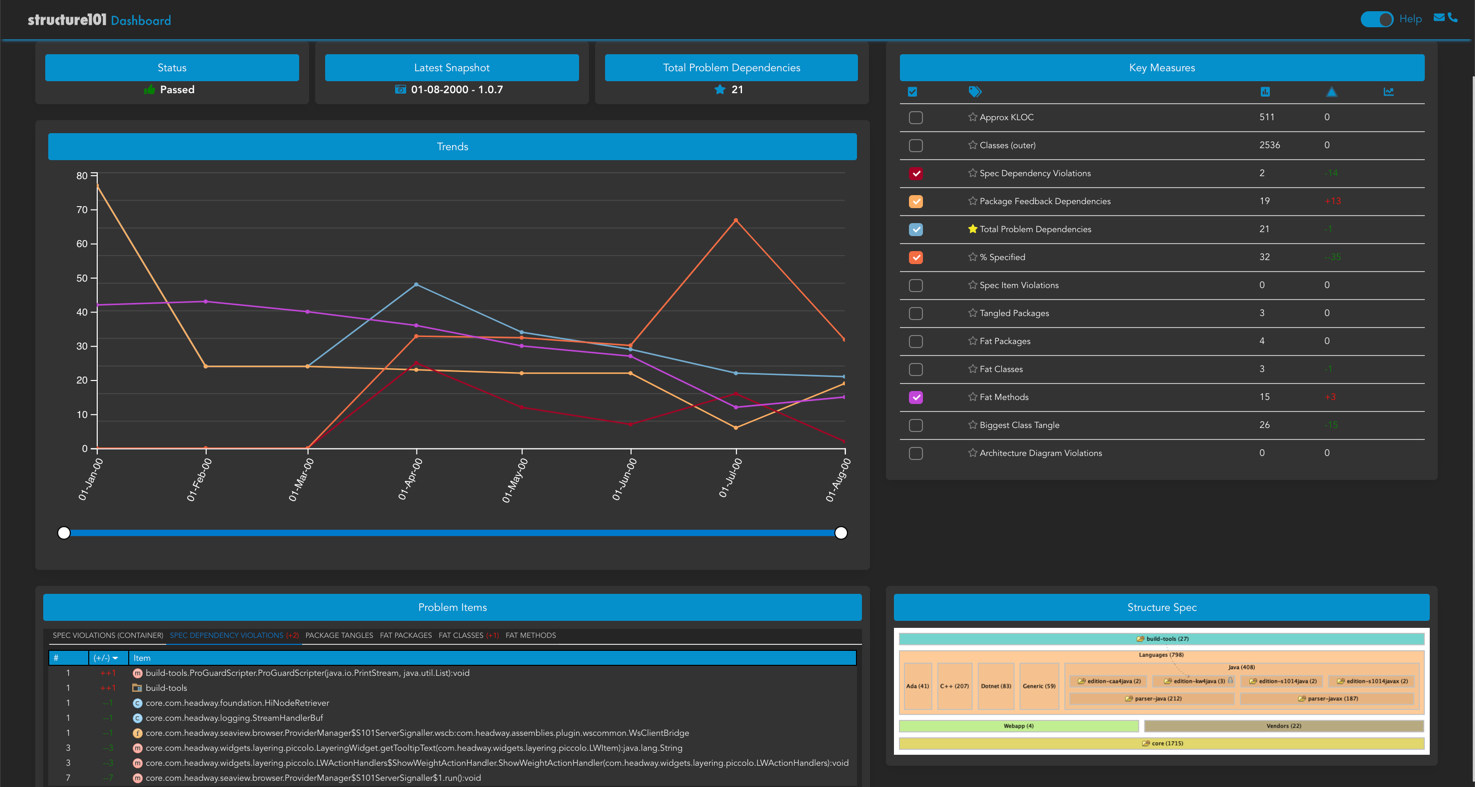
 The Structure101 Dashboard serves up the data that has been stored about a project in a Structure101 repository. This lets you see how the key measures are trending over time, and if any new issues have been created in the most recent snapshot (published by Studio or Build).
The Dashboard is displayed in your browser.
If you are running Workspace , and have a snapshot project open, then you can open the dashboard by clicking on a button in the Workspace UI.
By opening up the relevant port on your machine, you can share the Dashboard with others by sharing the URL.
It is also common to share a dashboard from a central repository. A new snapshot is typically published at build time (from Build), and the Dashboard server run in a company web server.
The root directory of the Dashboard zip file contains README files that describe how to deploy Dashboard to Tomcat and Docker.