The dependency matrix is an alternative to the diagram for visualizing dependency graphs. It is sometimes more concise than a diagram, and especially useful for larger graphs that cannot be rendered or easily understood as a diagram.
Here's what you need to know to understand and use dependency matrices:
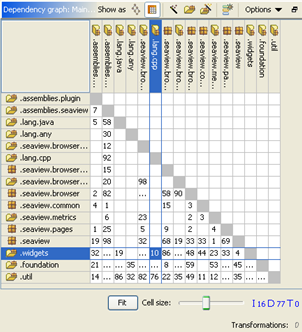
- The rows and columns are in the same order, starting from the top left.
- A number in a cell indicates the number of references from the column item to the row item (in the example, "util" uses "views" 8 times). (The numbers are the same as the number on the dependency edge in the equivalent diagram).
- The diagonal cells are grayed out - no item uses itself.
- Structure101 Studio "levelizes" the graph to determine the order of the items in the rows/columns. The algorithm minimizes the number of dependencies above the diagonal.
- If there are any dependencies above the diagonal, then the graph contains at least one tangle.
- The dependencies above the diagonal comprise a minimum feedback set - the least amount of dependencies that would need to be removed in order to make the graph acyclic. This is not necessarily the set that you consider undesirable, but it is an indication of the size of the tangle.
- Group by parent level, auto-partition, the graph contents viewer and the dependency breakout all work with the matrix in the same way that they work with diagrams.